Automatically scaling tactical analysis, crime bulletin and Compstat style text summaries
Published 4 August 2025
This walkthrough details a reproducible pipeline for text summarisation of recent felony offences across New York City using Python, Pandas and SQL.
Inspired by Andrew Wheeler’s Data Science for Crime Analysis with Python, an ideal starting point for crime analysts venturing into code, offering clear fundamentals and practical guidance. I continually return to this resource for its accessible explanations and easy-to-follow guide, which covers environment setup, modular coding, project structure and automated reporting.
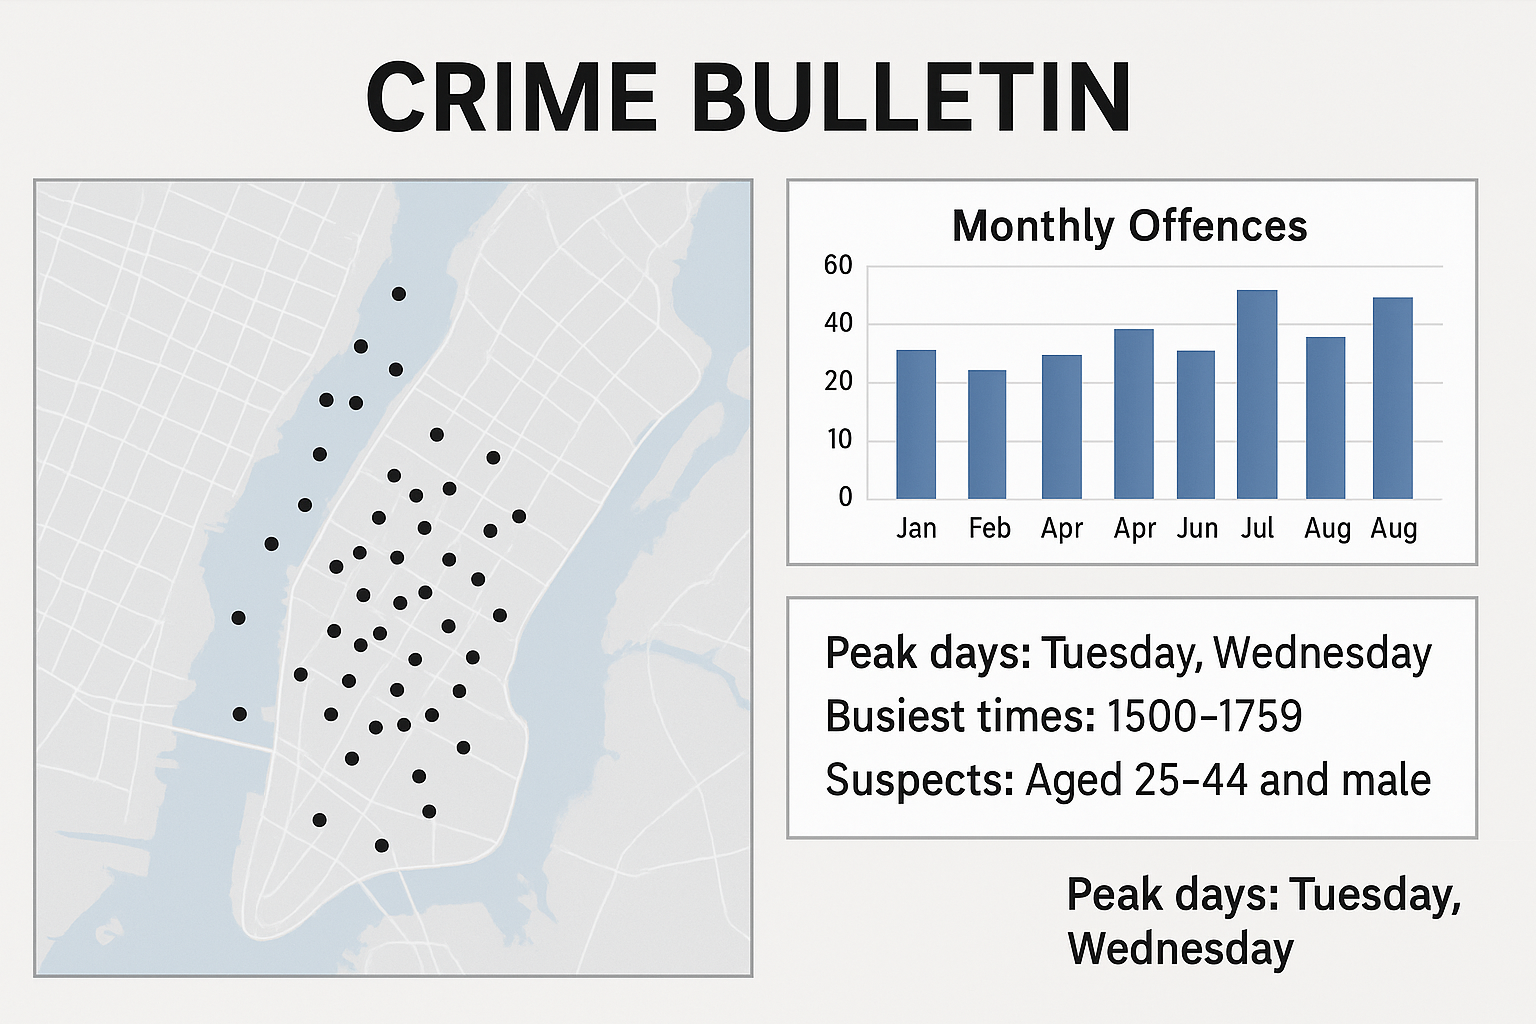
Amazing AI Image! Some maritime crime in the Hudson River, and emphasising that Tuesday and Wednesday is peak!
Why automate narrative summaries?
Crafting bulletins, CompStat-style reports, or crime pattern slides by hand is tedious, time-consuming and prone to errors. Automating the pipeline — from data retrieval through analysis to narrative generation — ensures standardisation, reduces bias and speeds up delivery. More importantly, it frees analysts to focus on detail-oriented work and sharpen specialised skills.
Tables and charts are essential for displaying volumes of data, revealing patterns and supporting detailed analysis — yet they assume the reader can immediately interpret axes, legends and statistical measures. Free-text summaries express the most critical takeaways into plain language, directing attention to key findings, explaining anomalies and providing context that visuals alone cannot convey.
Different audiences consume information in varied ways:
- Operational leaders may scan bulletins, tasking and briefing products before meetings.
- Non-technical stakeholders benefit from narrative explanations that translate metrics into real-world implications (i.e. ABC, Bottom Line Up Front/BLUF).
- Officers often need concise bullet-point insights they can absorb quickly before going on duty.
By pairing concise prose with tables and charts, analysts can meet diverse needs, speed comprehension, and reduce cognitive load, ensuring the right message reaches the right person in the most efficient format.
Andy’s book covers a detailed section on automating and reproducing charts and tables (Chp 10: An End to End Project Example), which you can view and download at:
https://github.com/apwheele/CrimeBook/tree/main
Automating text summaries of structured crime data
1. Setting Up the Environment
Data Science for Crime Analysis with Python (Chp 1. Setting up Python)
First, create and activate a Conda environment (or virtualenv) with the following core packages and in your notebook, import the necessary libraries:
pip install pandas sqlalchemy psycopg2-binary ipython jupyterlab
import pandas as pd
from IPython.display import Markdown, display
from sqlalchemy import create_engine, text
import requests
import sqlite3
These packages provide tools for data manipulation (pandas), database connectivity (SQLAlchemy, sqlite3, psycopg2), HTTP downloads (requests), and rich output (IPython.display).
Data Science for Crime Analysis with Python (Chp 7. An Introduction to SQL)
To work with a portable dataset, we download a pre-built SQLite file from GitHub:
url = (
    "https://raw.githubusercontent.com/"
    "routineactivity/adhoc_notebooks/main/"
    "crime_text_summaries/nyc_crime.sqlite"
)

r = requests.get(url)
r.raise_for_status()

with open("nyc_crime.sqlite", "wb") as f:
    f.write(r.content)

conn = sqlite3.connect("nyc_crime.sqlite")
df = pd.read_sql("SELECT * FROM nypd_recent_felonies_data", conn)
conn.close()

# inspect rows and columns
print(df.head())
This gives you a DataFrame df containing the last 28 days of felony offences (robbery, assault, burglary), extracted via SQLite.
Alternatively, if you have a live PostgreSQL instance with raw tables, you can fetch the same slice of data:
engine = create_engine(
    f"postgresql://{user}:{password}@{host}:{port}/{db}"
)

# query to pull most recent 28 days of records of interest
sql = text("""
SELECT *
FROM dev_nypd_data.crime_2020onwards
WHERE (cmplnt_fr_dt::date)
      >= (
        (SELECT MAX(cmplnt_fr_dt::date)
         FROM dev_nypd_data.crime_2020onwards)
        - INTERVAL '28 days'
      )
AND law_cat_cd = 'FELONY'
AND ofns_desc IN ('ROBBERY', 'FELONY ASSAULT', 'BURGLARY');
""")

# load into pandas
with engine.connect() as conn:
    df = pd.read_sql_query(sql, conn)

# inspect
print(df.shape)
df.head()
This df matches the SQLite export, and you can choose whichever source fits your workflow.
The source data can be found at the NYC Open Data store. NYPD produces a comprehensive set of open-source policing data, a great resource for training and learning crime analysis.
3. Data Cleaning in Pandas
Data Science for Crime Analysis with Python (Chp 6. Working with Tabular Data)
Before analysis, parse and enrich date/time fields:
- Parse dates and times: convert strings to
datetime and extract the hour.
- Day of week: derive weekday names for temporal patterns.
- 3-hour periods: bucket hours into ranges (e.g.
00:00-02:59, 03:00-05:59, etc).
# parse dates and times
df['cmplnt_fr_dt'] = pd.to_datetime(
    df['cmplnt_fr_dt'],
    errors='coerce'
)

# NB: the SQLite reads in times as format='%H:%M:%S.%f'
# if using another data source, check the format of cmplnt_fr_tm_time
df['cmplnt_fr_tm_time'] = pd.to_datetime(
    df['cmplnt_fr_tm_time'],
    format='%H:%M:%S.%f',
    errors='coerce'
)

df['cmplnt_fr_tm_time'] = df['cmplnt_fr_tm_time'].dt.time

# extract hour
df['hour'] = pd.to_datetime(
    df['cmplnt_fr_tm_time'].astype(str),
    format='%H:%M:%S',
    errors='coerce'
).dt.hour

# derive day of week
df['day_of_week'] = df['cmplnt_fr_dt'].dt.day_name()

# derive 3-hour periods
bins = list(range(0, 25, 3))
labels = [f"{b:02d}:00-{(b+2):02d}:59" for b in bins[:-1]]
df['period'] = pd.cut(
    df['hour'],
    bins=bins,
    right=False,
    labels=labels
)
These steps ensure you have consistent datetime types, an integer hour column, human-readable weekdays, and labelled time intervals.
4. Generating Summaries by Boro and Crime Category
Data Science for Crime Analysis with Python (Chp 2. Getting started writing python code, Chp 3. Working with strings, Chp 4. Iterating over objects, Chp 6. Working with Tabular Data)
Now we loop through each borough and offence type to compute counts, percentages, and top categories. We start by defining a helper:
# helper to get top-3 from any summary
def top_n(summary_df, label_col):
    return [
        (getattr(r, label_col), r.count, r.percent)
        for r in summary_df.head(3).itertuples()
    ]
Inside the loop, for each (borough, crime) subset, you:
- Compute value counts for days, periods, premises location types, and precincts.
- Calculate crime completion rate (
crm_atpt_cptd_cd == 'COMPLETED').
- Tabulate victim and suspect demographics.
- Build small DataFrames with
count and percent.
- Extract the top three categories via
top_n().
- Feed results into a Markdown template for display.
# loop through boroughs and crime categories
boroughs = df['boro_nm'].dropna().unique()
crimes = df['ofns_desc'].dropna().unique()

for borough in boroughs:
    for crime in crimes:
        subset = df[
            (df['boro_nm'] == borough) &
            (df['ofns_desc'] == crime)
        ]

        if subset.empty:
            continue
This approach produces a clear, reusable summary for each combination, ideal for exploratory analysis or reporting.
Within the loop there is a function to produce summary tables, and a descriptive narrative template to assign the values:
# summary dfs
def make_summary(idx, counts, total):
    return pd.DataFrame({
        idx: counts.index,
        'count': counts.values,
        'percent': counts.values / total
    }).sort_values(
        'count',
        ascending=False
    ).reset_index(drop=True)

# descriptive narrative template
template = (
    "## Overview of {crime} in {borough}\n\n"
    "There were {total_n} offences reported.\n\n"
    "**Peak days**: {day1} ({day1_n}, {day1_pct:.1%}), "
    "{day2} ({day2_n}, {day2_pct:.1%}), "
    "{day3} ({day3_n}, {day3_pct:.1%}).\n\n"
    "**Busiest periods**: {time1} ({time1_n}, {time1_pct:.1%}), "
    "{time2} ({time2_n}, {time2_pct:.1%}), "
    "{time3} ({time3_n}, {time3_pct:.1%}).\n\n"
    "**Offences completed**: "
    "({completed_count}, {completed_percent:.1%}).\n\n"
    "**Top premises**: {loc1} ({loc1_n}, {loc1_pct:.1%}), "
    "{loc2} ({loc2_n}, {loc2_pct:.1%}), "
    "{loc3} ({loc3_n}, {loc3_pct:.1%}).\n\n"
    "**Top precincts**: {pct1} ({pct1_n}, {pct1_pct:.1%}), "
    "{pct2} ({pct2_n}, {pct2_pct:.1%}), "
    "{pct3} ({pct3_n}, {pct3_pct:.1%}).\n\n"
    "**Victim** ages: {v_age1}, {v_age2}, {v_age3}; "
    "{victim_pct_male:.1%} male; race "
    "{victim_pct_black:.1%} Black, "
    "{victim_pct_white:.1%} White, "
    "{victim_pct_hispanic:.1%} Hispanic.\n\n"
    "**Suspect** ages: {s_age1}, {s_age2}, {s_age3}; "
    "{suspect_pct_male:.1%} male; race "
    "{suspect_pct_black:.1%} Black, "
    "{suspect_pct_white:.1%} White, "
    "{suspect_pct_hispanic:.1%} Hispanic."
)
The full loop code and notebook can be found here:
Looping_Summary_sqlite.ipynb
The Final Result
Through combining SQL and Python, relying on pandas for cleaning and summarisation, the pattern shown here scales to multiple jurisdictions and categories of information.
There is potential to create bespoke crime problem-specific narratives, and additional fields of information such as stolen property, vehicles and modus operandi codes, for example.
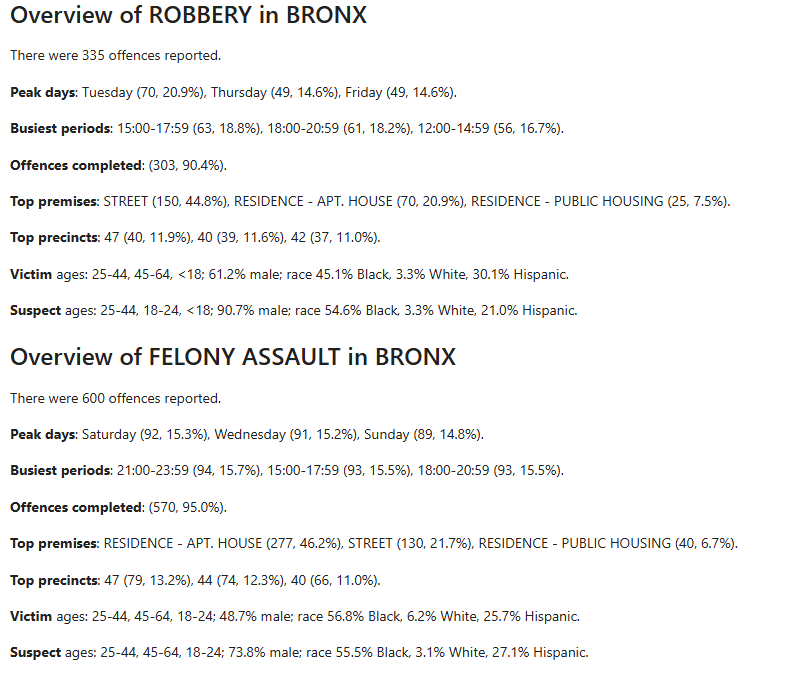
Snippet of text summaries automated by NY Boro and Crime Type
Further reading
TL; DR
Comparing automation approaches Crime Data vs. Criminal Intelligence
Automating summaries of crime data (tabular structured data) in the described method offers clear benefits — consistent output, rapid processing at scale, and reproducible insights. The risk remains low provided the underlying data structure and quality are well understood.
Automating summaries of criminal intelligence (free text, raw unstructured data) such as incident narratives, witness interviews, or officer notes can surface themes and trends hidden in text, standardise coding, and accelerate review (see examples below). Risks may increase depending on the intended use (e.g., operational decision-making), including interpretation errors, misreading of context or slang, and embedding biases present in the source language.
There is likely a need to balance qualitative intelligence pipelines with targeted human review or hybrid human/AI(NLP) models to achieve nuanced insights.
See recent example use-cases below:
Why choose Python/Pandas over AI Agents for structured crime data summaries?
While LLMs excel at generating human-readable text, using Python for data-driven summaries offers advantages. Python connects natively to databases, handles millions of rows efficiently, and integrates with GIS and analytics libraries. Code logic produces predictable, controlled summaries based on explicit transformations, avoiding AI hallucinations or context drift. Functions and modules can be tailored to bespoke metrics, automated checks, and project-wide standards — unlike ad-hoc prompts.
Local execution is also more cost-effective.
I originally posted this on Medium