If you’re working in law enforcement or with crime data, it’s quite likely that you will have been asked to produce data aggregated to a large spatial unit — like a neighbourhood, census block or ward, or even areas as large as cities and towns — for the purpose of prioritising geographical locations for additional resource
But is that an efficient way to target geographically?
Perhaps a rationale behind such requests is that large defined political or statistical areas are more familiar to most people. We know our city, our neighbourhood, ward or district name. Unless we’re working on the frontline, specific streets may be less familiar or seem too small.
However, there is much that has been written about the benefits of smaller spatial units (for crime analysis). Repeated evidence finds that crime clusters consistently in small (micro) geographic units, at the street level.
For a detailed extensive literature review and research search for ‘Law of Crime Concentration’
I recently stumbled on an old slide deck I’d saved (by Dr Chris Herrmann, John Jay College of Criminal Justice). The visuals make the case for focusing on micro-units, far better than text, tables and charts, and so I have reproduced them with data for a city more familiar to me.
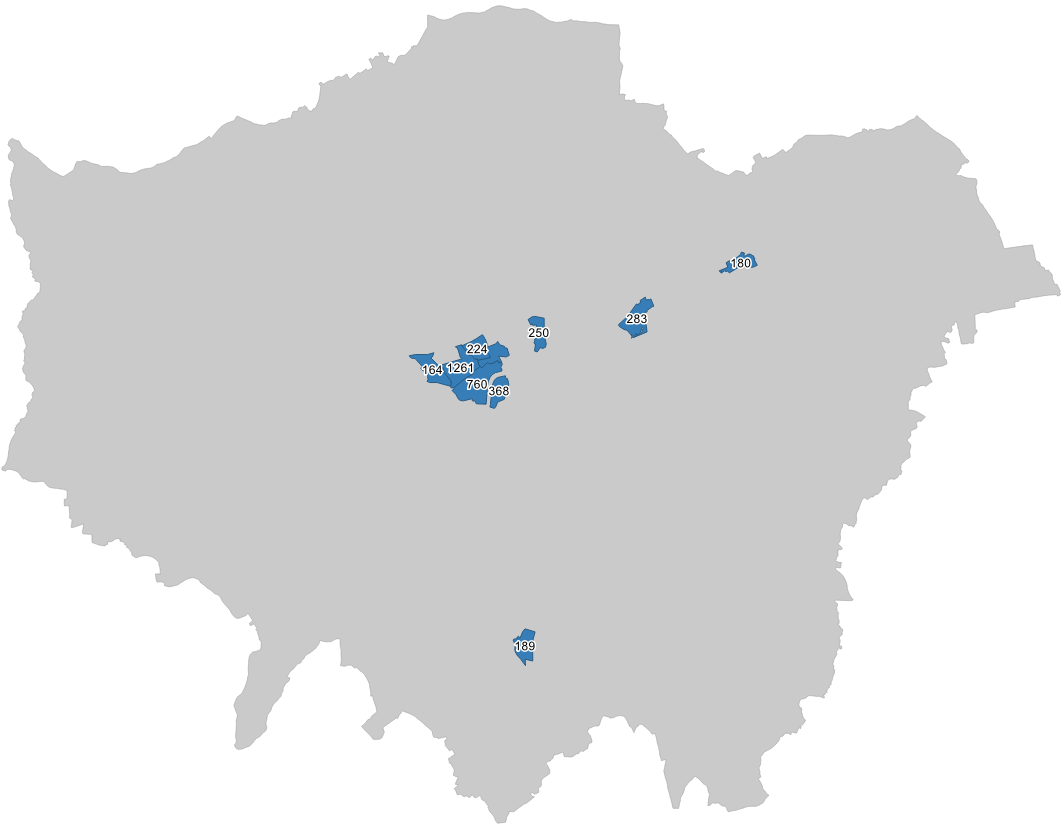
1. Here we take robbery data (police.uk) for the Metropolitan Police Service in London for 2022. I’ve aggregated and mapped the Top 10 highest wards for robbery. These wards contain 15% of all robberies recorded.
Sounds good. 10 areas is a nice and easy number to allocate resources to. This area covers 6.3 square miles, or 222 miles of street network.
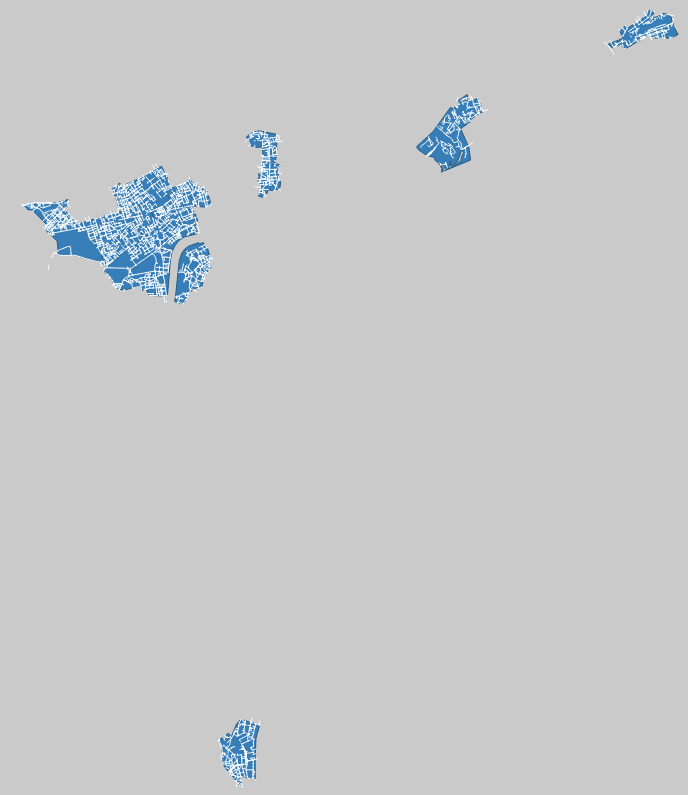
2. However, if we analyse the number of robberies per the street network, we find that 82% of streets in these wards had NO ROBBERY offences. These streets are shown in white in the image below.
Asking resources to focus efforts in political Wards, we might presume as much as 82% of the proactive time spent could be within crime-free streets.
Whilst there were over 200 miles of streets in the top ten wards all robberies occurred in less than 20 miles of that.
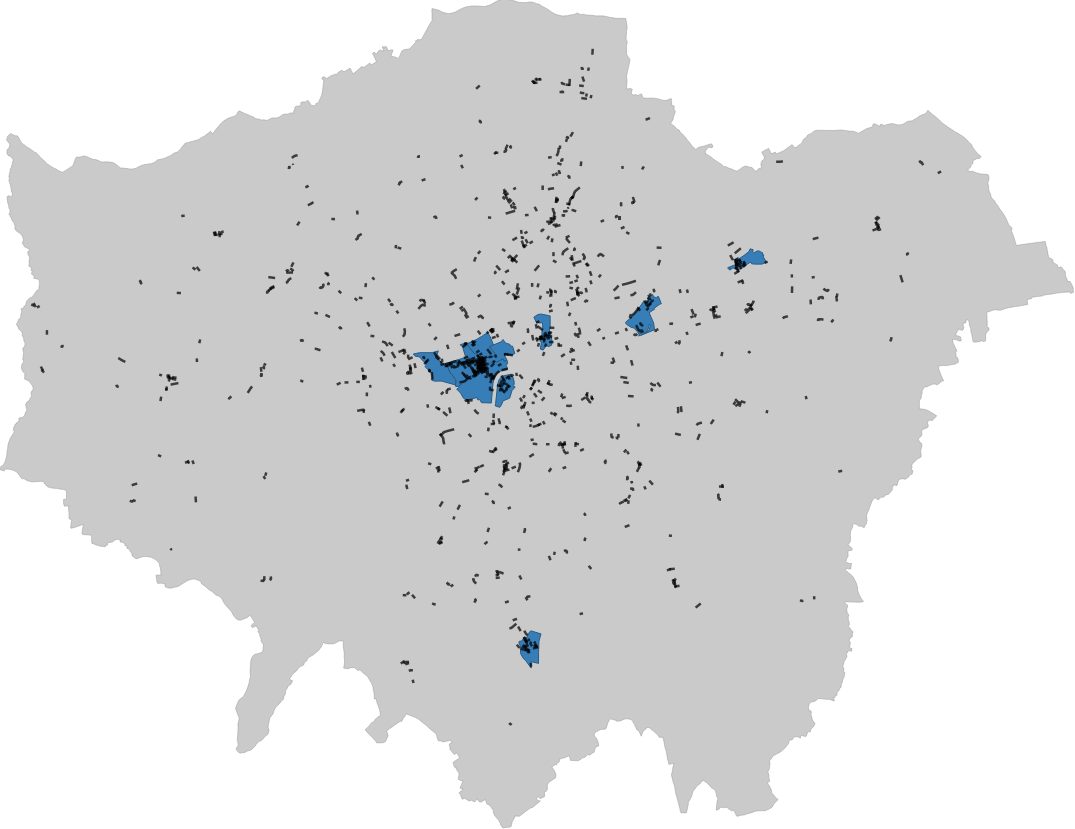
3. If we now map the streets containing 15% of all robberies in London, we find that many of these are beyond the Top 10 wards.
These streets make up 60 miles of London’s entire street network (compared to 222 miles in our Top 10 wards), but each segment here experienced multiple offences.
Replicating the visuals of Dr. Chris Herrmann (JJCCJ), we can demonstrate more clearly how smaller units of spatial analysis could achieve greater efficiency, whilst avoiding sending resources to be spread thinly across many locations with little or no crime.
Herrmann’s (2020), top reasons advocating for [small units] (*slide deck is ‘Why hot streets are better than hotspots’):
- Most streets in high-crime wards have little/no crime
- Most streets in hotspots have little/no crime
- Many of the hottest crime streets are not located in city-wide hotspots OR city-wide high crime wards
- Frontline resources understand street names much more than ward boundaries and graduated hotspot surfaces
Originally posted on Medium.
Further reading